A dashboard displays important and relevant business management information (BMI) and key performance indicators (KPIs) to specific business stakeholders when they need it. Consider a well-designed dashboard organizes and visualizes important metrics and information for these stakeholders to quickly analyze and ascertain business performance, then understand how to act upon that business information.
Clicking the Home icon ![]() in the breadcrumbs displays the dashboard for that logged on user.
in the breadcrumbs displays the dashboard for that logged on user.
Designing dashboards comprises of a Display-type Screen. To incorporate relevant BMI and KPIs, create Saved Search charts of your Saved Search data, and then add those Saved Search charts to the Screen using the Saved Search Chart control in Screen Builder.
See dashboard design best practices for design ideas.
View All Dashboards
Follow these steps to view all the dashboards in your organization:
Ensure that you are logged on to ProcessMaker Platform.
Click the Admin option from the top menu. The Users page displays.
Click the Customize UI icon
 from the left menu. The Customize UI page displays and shows the Site Design tab by default.
Click the Dashboards tab to displays all dashboards.
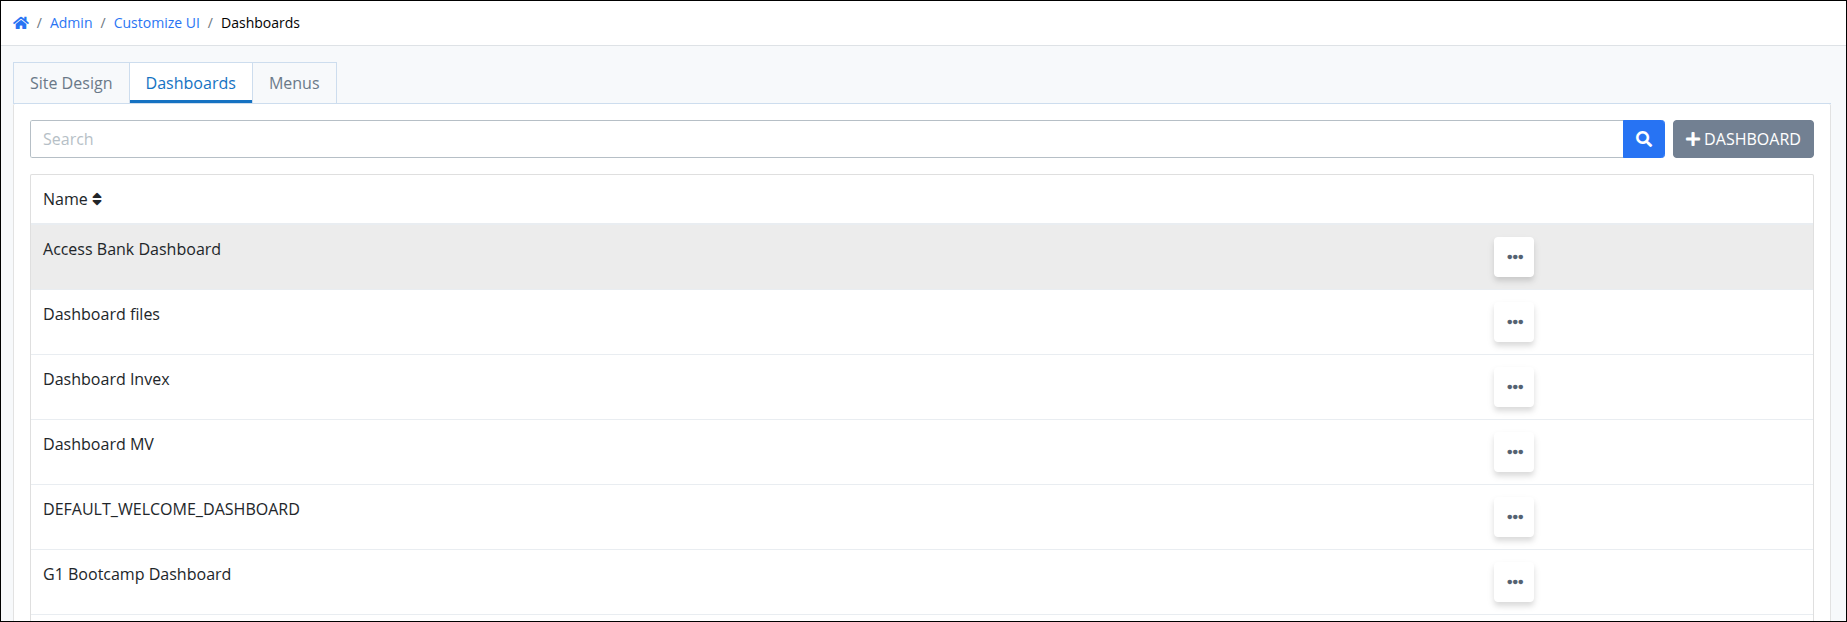
The Dashboards tab displays the name of each dashboard under the Name column and provides options to view, edit or delete these dashboards.
Click the
 menu for the dashboard to view.
Click the
 Open Dashboard option . The dashboard opens in a new Web browser window.
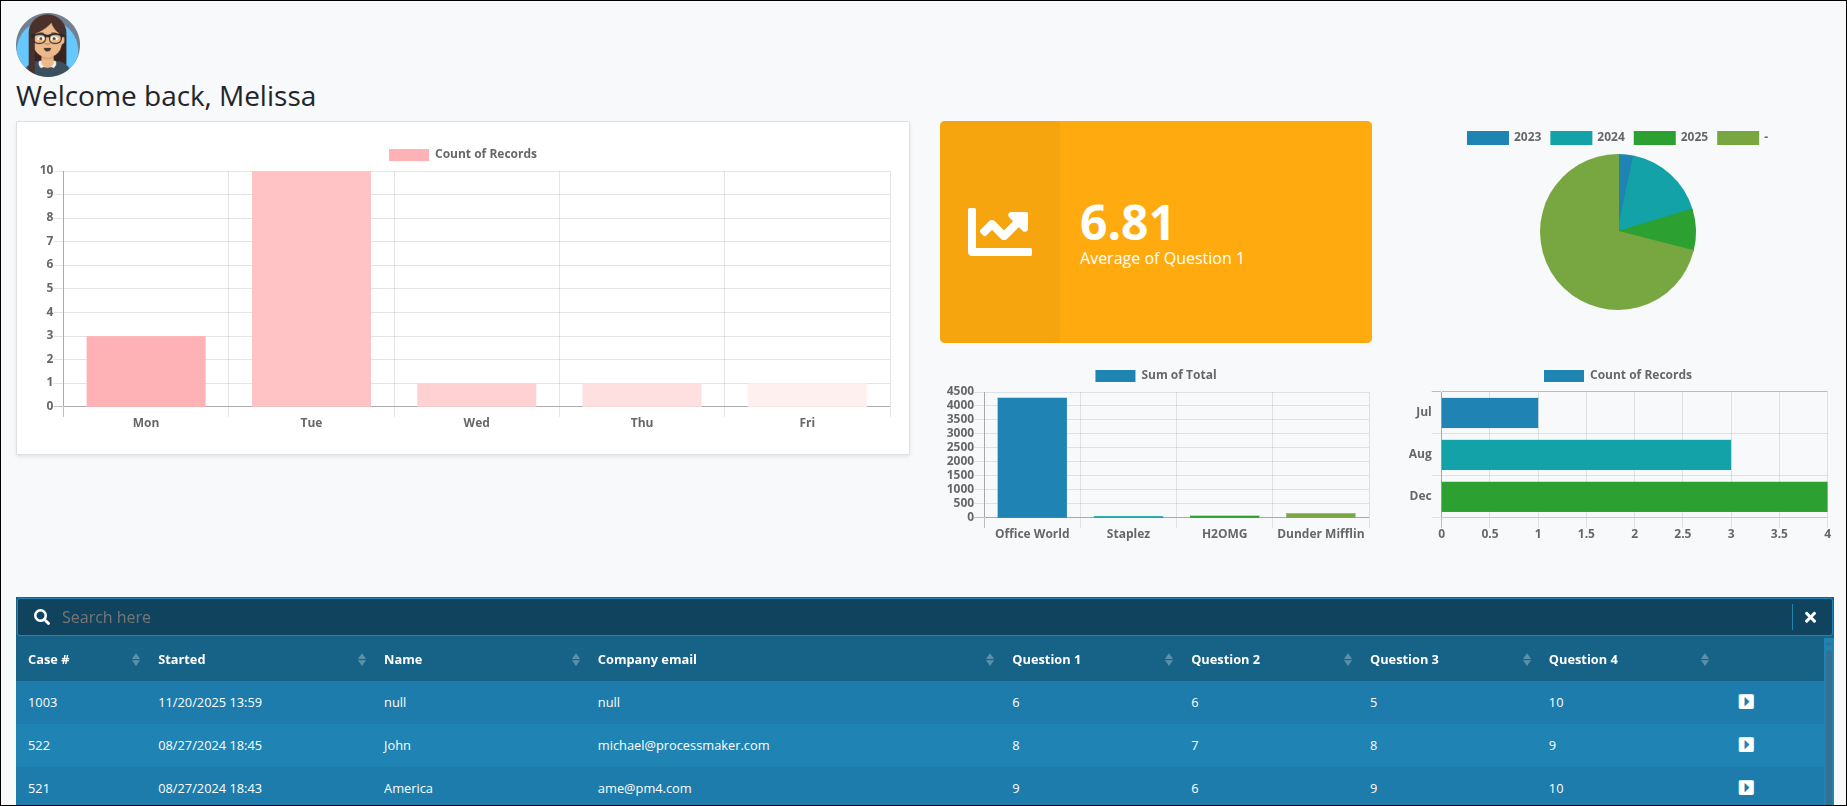
Create a Dashboard
Before creating a dashboard, ensure that the required ProcessMaker assets for that dashboard already exist.
Dashboards are built using a Display-type Screen. To incorporate relevant key metrics and indicators, follow these steps:
Create Saved Searches using the data you want to display.
Create Charts from those Saved Searches.
Open the Display-type Screen in Screen Builder or create a new one.
Add the Saved Search Chart control to the Screen.
Select the Saved Search chart you want to display in the Screen for the Dashboard.
The Screen is ready to use when creating a Dashboard.
Follow these steps to create a dashboard:
View all dashboards in your organization. The Dashboards tab displays:
Click the +Dashboard button. The Create Configuration Dashboard screen displays.
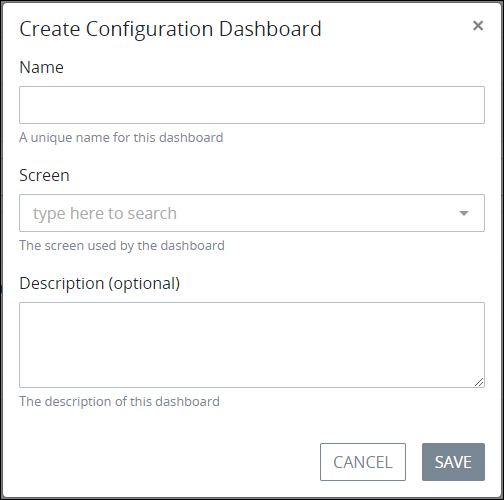
In the Name setting, enter a unique name for the dashboard. This is a required setting.
From the Screen setting, select the Display-type Screen designed with content for the dashboard. This is a required setting.
In the Description (optional) setting, enter a description for the dashboard.
Click Save. The following message displays after creating the dashboard: Configuration Dashboard Updated.