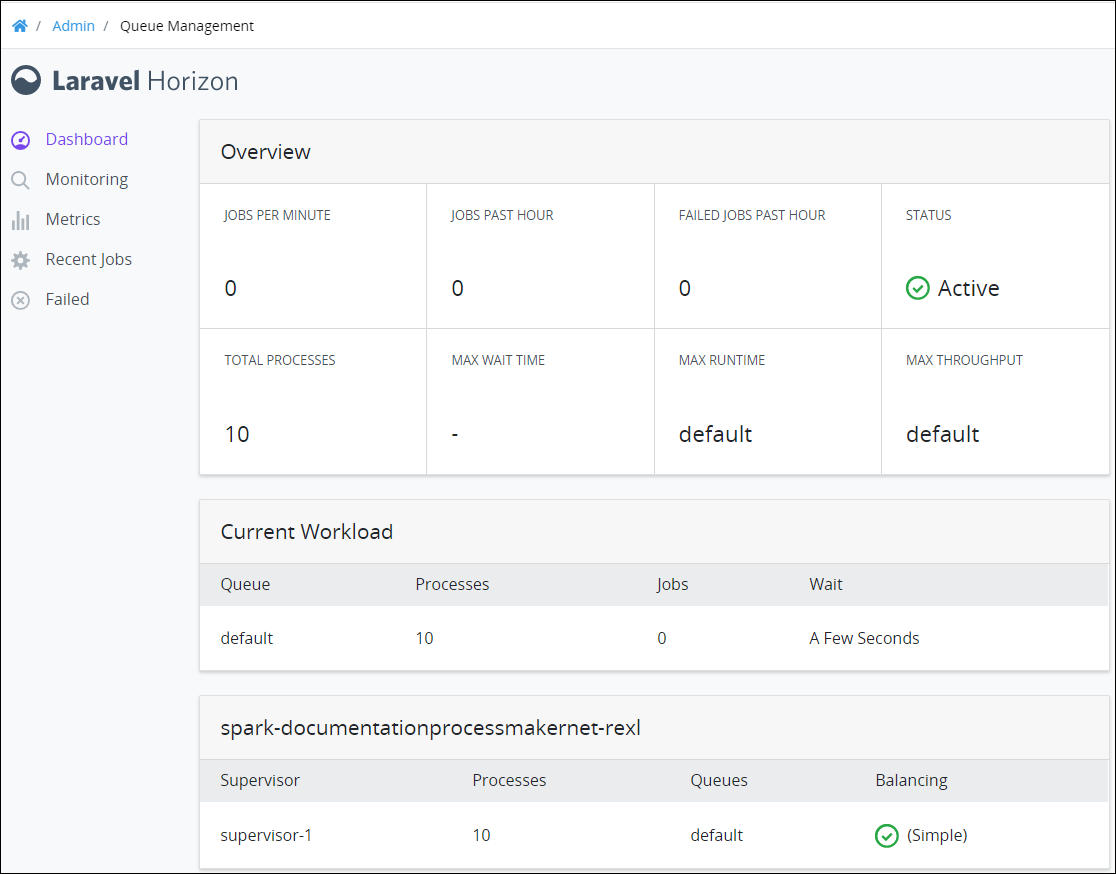
The Queue Management Dashboard provides an overview of your ProcessMaker Platform instance's status, throughput, and workload.
Overview
The Queue Management Dashboard displays an overview of your ProcessMaker Platform instance's status. The Dashboard displays by default in Queue Management.
Permission
Your user account must have the Make this user a Super Admin option selected to view the Queue Management Dashboard.
See Edit a User Account or ask your Administrator for assistance.
Follow these steps to view the Queue Management Dashboard:
Log on to ProcessMaker Platform.
Click the Admin option from the top menu. The Users page displays.
Click the Queue Management icon
 from the left sidebar. The Queue Management Dashboard displays.
Click Dashboard to view the Dashboard from another Queue Management page.

The Dashboard displays in the Overview panel the following metrics about your ProcessMaker Platform instance:
Jobs Past Hour: The Jobs Past Hour metric displays how many jobs ran in the queue in the past hour.
Failed Jobs Past Hour: The Failed Jobs Past Hour metric displays how many queued jobs failed in the past hour. See View Recently Failed Jobs.
Status: The Status metric displays the status of the ProcessMaker Platform instance. The following status types are possible:
Active: The ProcessMaker Platform instance is active.
Inactive: The ProcessMaker Platform instance is inactive.
Error: The ProcessMaker Platform instance has an error.
Total Processes: The Total Processes metric displays how many processes the job queue is using.
Max Wait Time: The Max Wait Time metric displays the maximum wait time the queue has required to run a recent job in real-time. If there is no wait time, then this metric displays the following: -.
Max Runtime: The Max Runtime metric displays the name of the job queue that has the maximum runtime.
defaultis the name of the default queue.Max Throughput: The Max Throughput metric displays the name of the job queue that has the maximum throughput.
defaultis the name of the default queue.
The Dashboard displays in the Current Workload panel the following information about the jobs queue:
Queue: The Queue column displays the name of the jobs queue.
Processes: The Processes column displays how many processes the job queue is using.
Jobs: The Jobs column displays how many jobs are active presently.
Wait: The Wait column displays an indicator of how much time is required to run all jobs in the queue.
The Dashboard displays a panel labeled with the name of the ProcessMaker Platform instance that contains the following information:
Supervisor: The Supervisor column displays the supervisor name. The supervisor monitors the default queue.
Processes: The Processes column displays how many processes the job queue is using.
Queues: The Queues column displays the name(s) of the job queue(s).
Balancing: The Balancing column displays the balancing strategy to manage jobs in the queue(s). The Simple strategy splits incoming jobs evenly between processes.