View the Charts for a Type of Saved Search
Follow these steps to view the charts for a type of Saved Search:
View the search results for a Saved Search in which to view its charts. The Data tab displays the data details for that Saved Search.
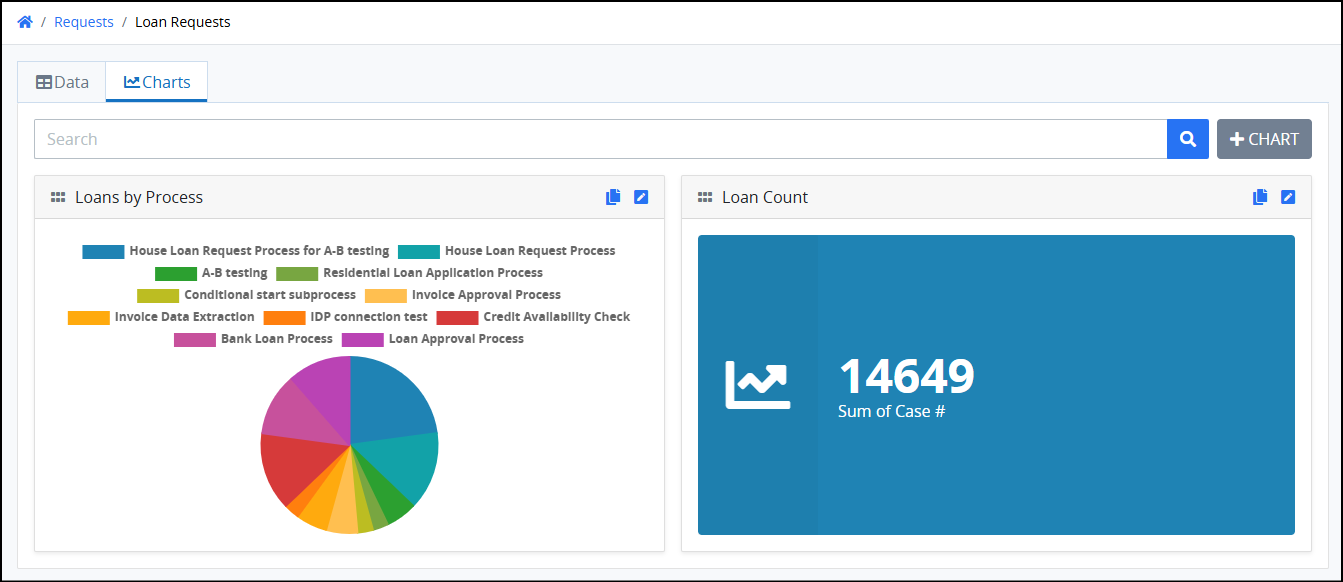
Click the Charts tab. The Charts tab displays a maximum of ten (10) charts created for this Saved Search. If there are no charts for this Saved Search, the following message displays: No Charts Created: Add a chart to visualize the data from your Saved Search results.

You can take one of the following actions:
Create a Saved Search Chart: Click the +Chart button. See Create a Saved Search Chart.
Edit a Saved Search Chart: Click the Edit Chart icon
 to modify Charts in the same way as when creating a new Saved Search Chart.
Arrange the Order of Saved Search Charts: Hold the
 icon to the left of the chart's title, then drag the chart to your desired location on the Charts tab to display it.
Copy a Saved Search Chart: Click the Copy Chart icon
 on the chart you want duplicate. The copied chart will have the same name as the original, with Copy appended to it.
Delete a Saved Search Chart: Follow these steps to delete a Saved Search Chart:
Click the Edit Chart icon
 for the chart you want to delete.
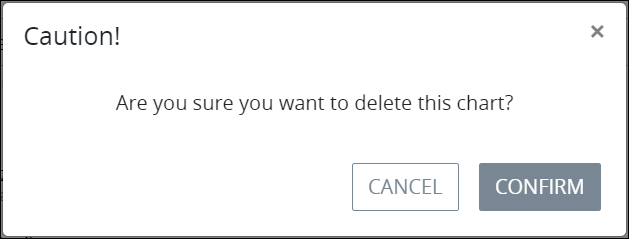
Click the Delete button at the bottom-left. A confirmation screen appears to verify the deletion of the Saved Search chart.

Click Confirm. A message appears stating: The chart was deleted.