Access real-time process analytics directly from the Process Launchpad to make faster, data-driven decisions and optimize performance. Fully embedded within the ProcessMaker platform, these analytics provide immediate insights through intuitive dashboards, eliminating the need for external tools.
View real-time, process-specific analytics directly from the Launchpad without switching platforms.
The analytics dashboard displays custom charts styled with Process Intelligence (PI), providing process-specific insights.
Users can monitor, analyze, and optimize their processes using built-in analytics, improving efficiency and performance.
Improved data processing and faster dashboard load times ensure better handling of large datasets, offering smoother performance for analytics-heavy tasks.
.jpg)
View Analytics
Process Analytics offers pre-configured reports that provide valuable insights into the performance of your Processes.
View analytics about Cases and Tasks.
Get an overview of activities across the platform.
Review the historical performance of a single Process or Case.
Analyze how Process design impacts performance.
Filter data to drill down to more detailed levels of analysis.
View performance trends over time.
Export data to a CSV file.
Follow these steps to view Process Analytics:
Ensure that you are logged on to ProcessMaker Platform.
Click the Analytics option from the top menu to view a list of processes in your organization.
Alternatively, you can also access Analytics from the Process Launchpad.
Click on a process to view detailed analytics for that process.
The Analytics reports provide the following information:
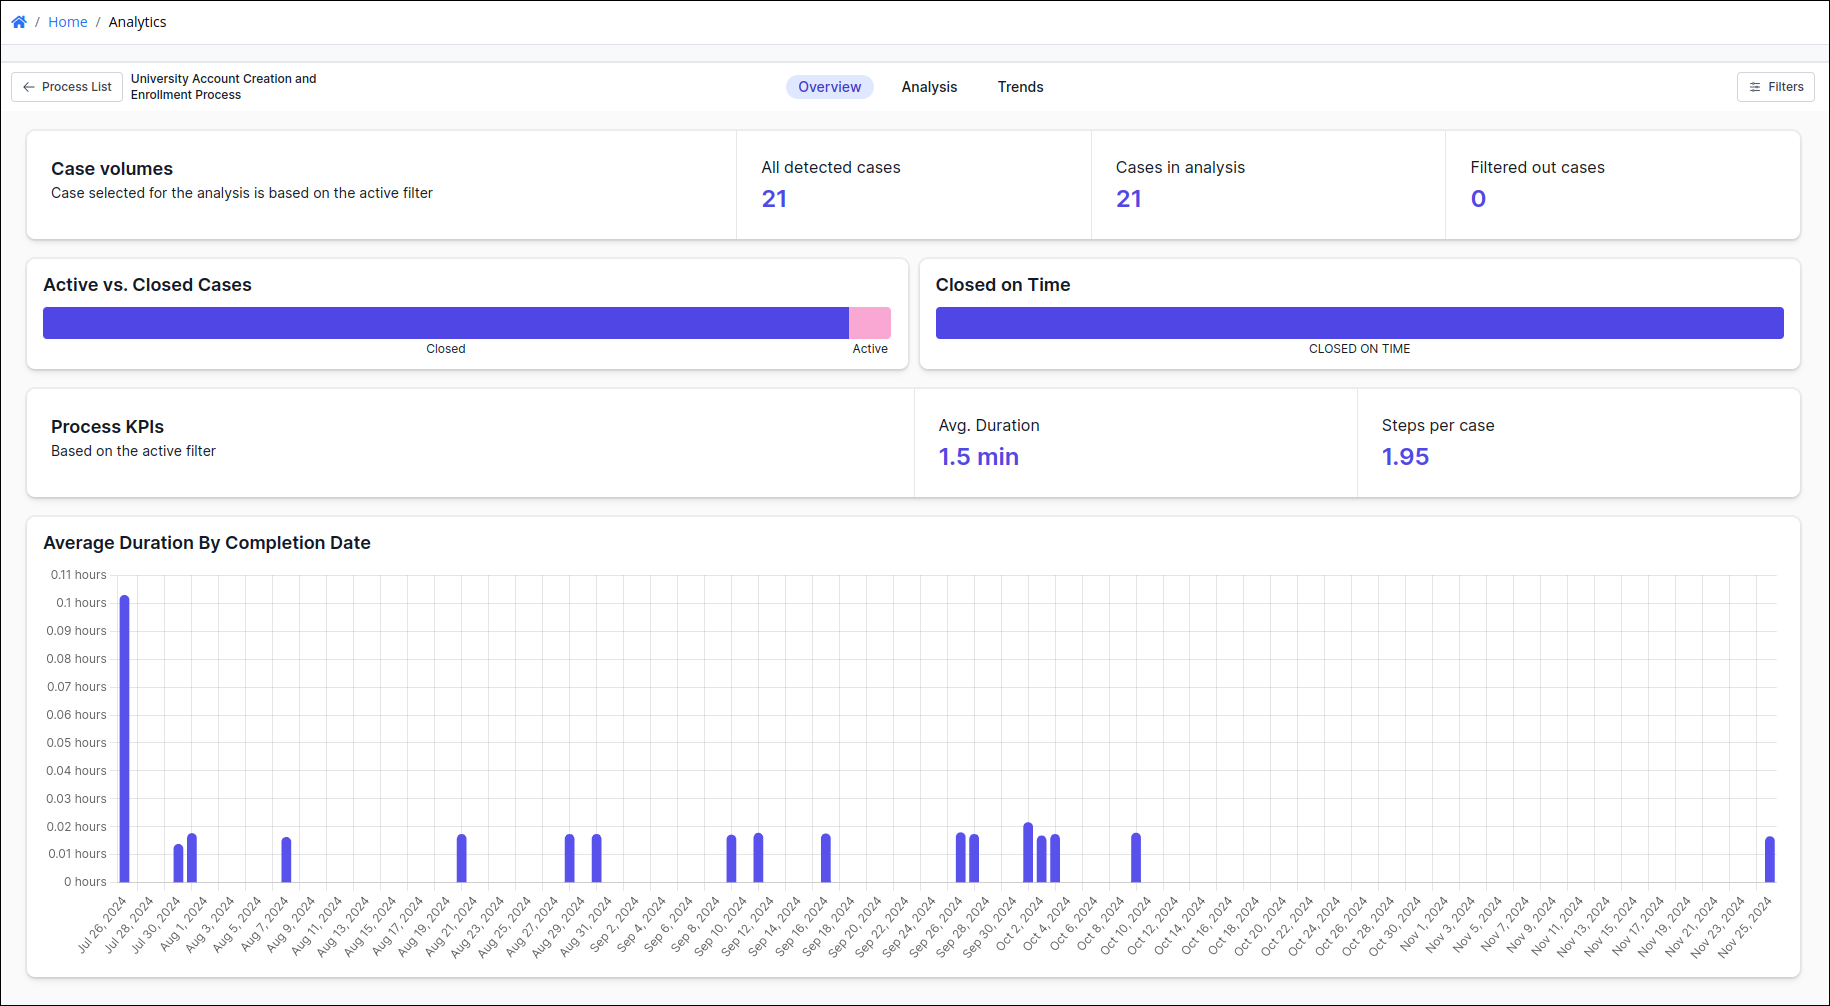
The Overview tab provides a comprehensive summary of case performance and key metrics, including:
Total Case volume.
Number of active and closed Cases.
Numbers of Cases closed within the defined due dates.
Process KPIs, such as average duration or steps per Case.
Use the Filter button to filter based on dates, metrics, or other criteria.
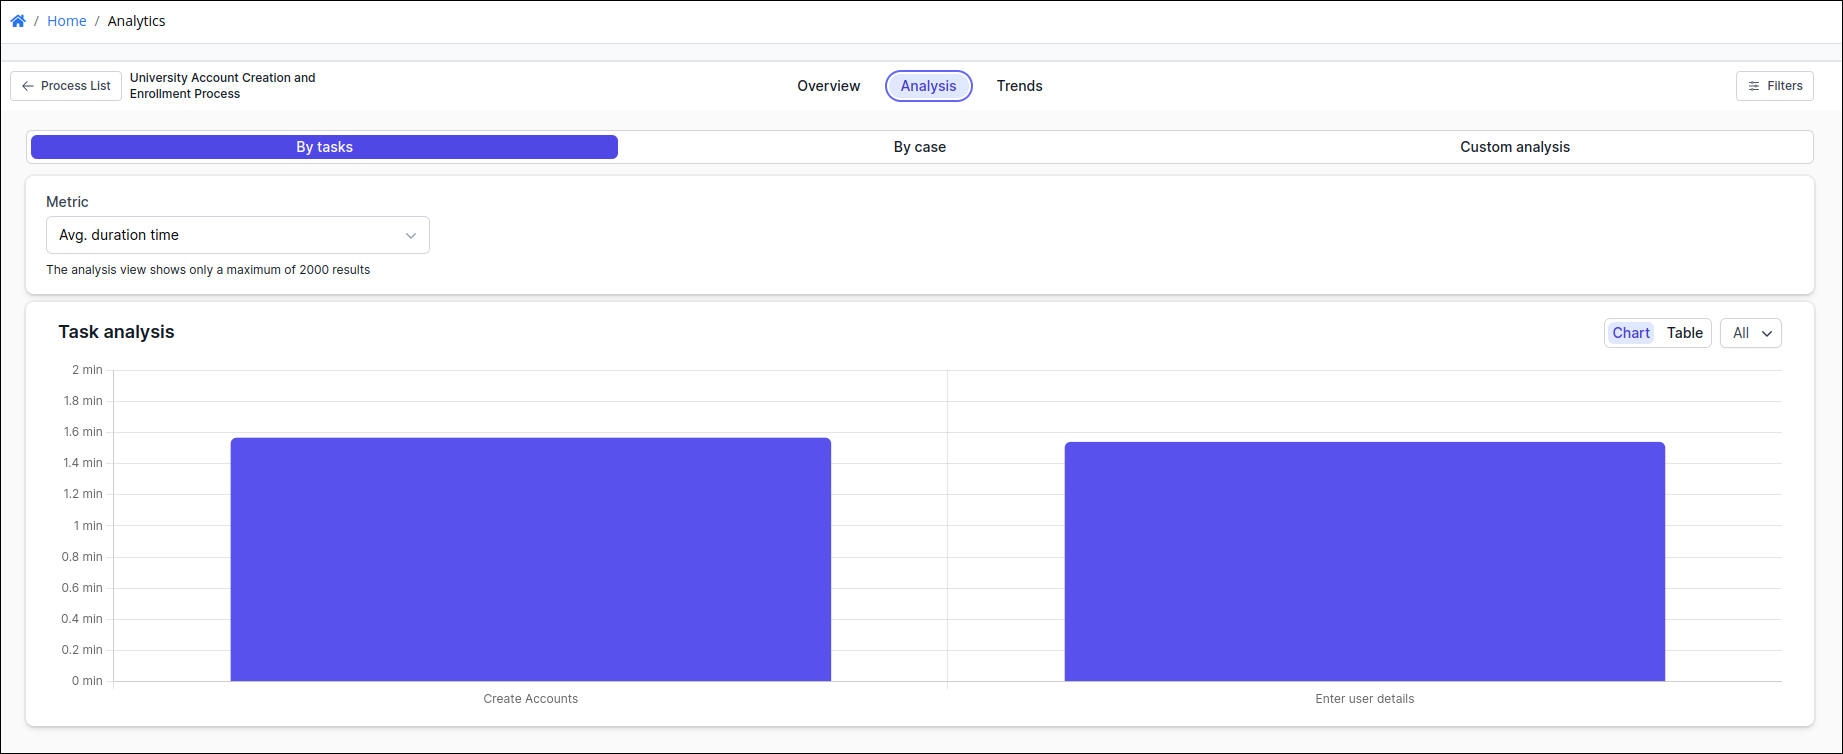
The Analysis tab offers an in-depth view of process metrics and performance, including the following:
Total number of Cases.
Total complete time.
Average completion time.
Cases completed during specific time periods.
Tasks per Case.
Drill down to view detailed data about individual Cases.
Create custom charts through filtering.
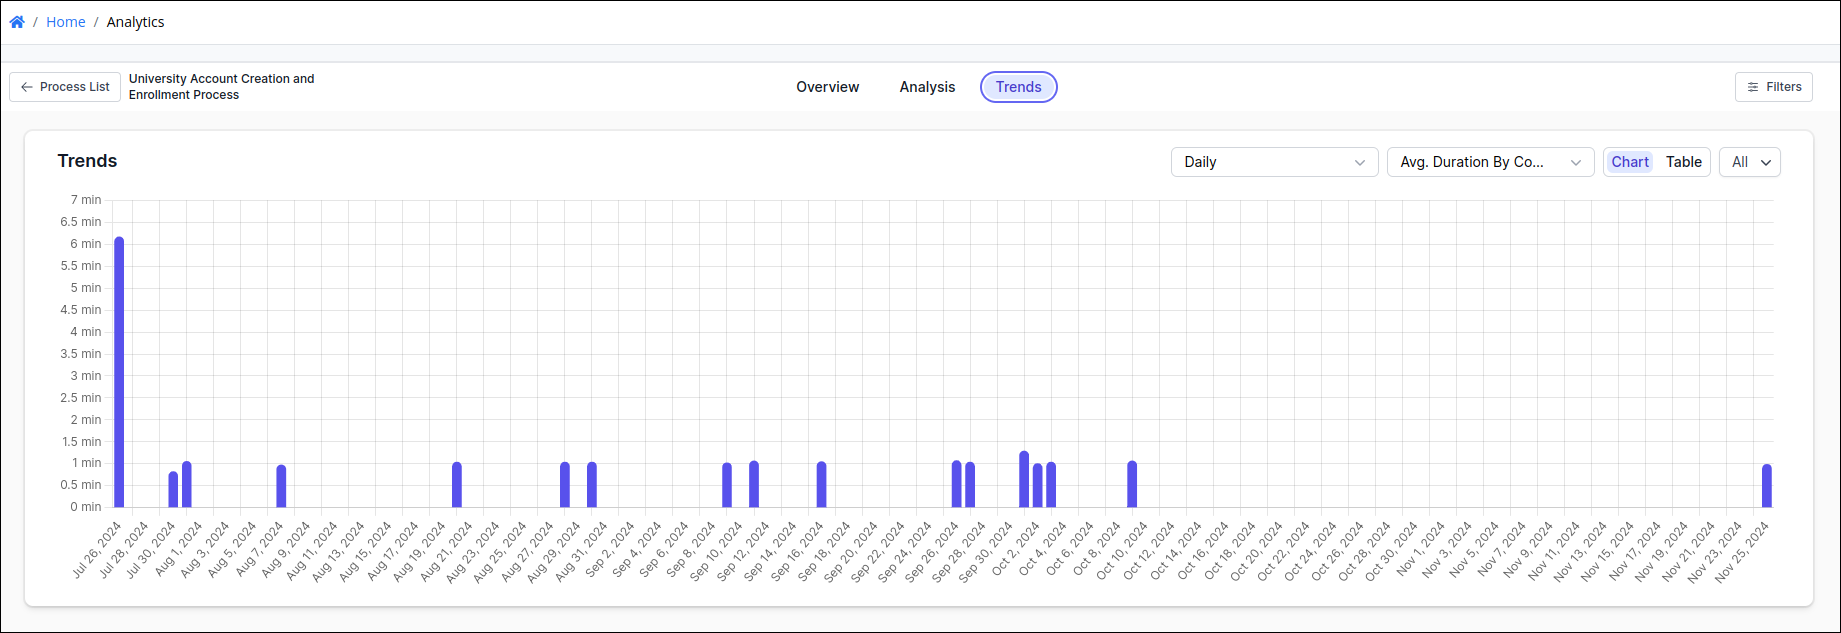
The Trends tab showcases the performance of Cases over time, featuring the following options:
View started and completed Cases.
Switch between chart and table view.
Create filters to view specific data.