The Saved Search Chart control embeds a chart from a Saved Search into a Screen. The Saved Search chart visualizes the latest Saved Search result data at the time the Screen displays. The Saved Search chart is interactive as if it were in the Charts tab of its Saved Search. By embedding a Saved Search chart into a Screen widens that chart's viewability to more stakeholders or even individuals who are not users in your organization by allowing anonymous users access ProcessMaker via the Web Entry.
Use the Saved Search Chart control to visualize Saved Search results directly within Screens in the following ways:
Request participants can view the current chart configured for a Saved Search using the latest Request data at the time the Request participant views the Screen.
Request participants who do not have access to Collections can view charts for Saved Searches based on a Collection.
This control is only available for the following Screen types:
Display type
Form type
See Screen Types.
Add the Control to a Screen
Permissions
Your user account or group membership must have the following permissions to design a Screen unless your user account has the Make this user a Super Admin setting selected:
Screens: Edit Screens
Screens: View Screens
See the Screens permissions or ask your Administrator for assistance.
Follow these steps to add this control to the Screen:
Create a new Form-type or Display-type Screen or edit an existing one.
From the Controls Menu on the left, expand the Advanced category, and then locate the Saved Search Chart icon
 .
.Drag and drop the control to the Screen Builder canvas. Existing controls in the Screen will adjust positioning based on where you drag the control.

Configure the Saved Search Chart control. See Settings.
Validate that the control is configured correctly. See Validate Your Screen.
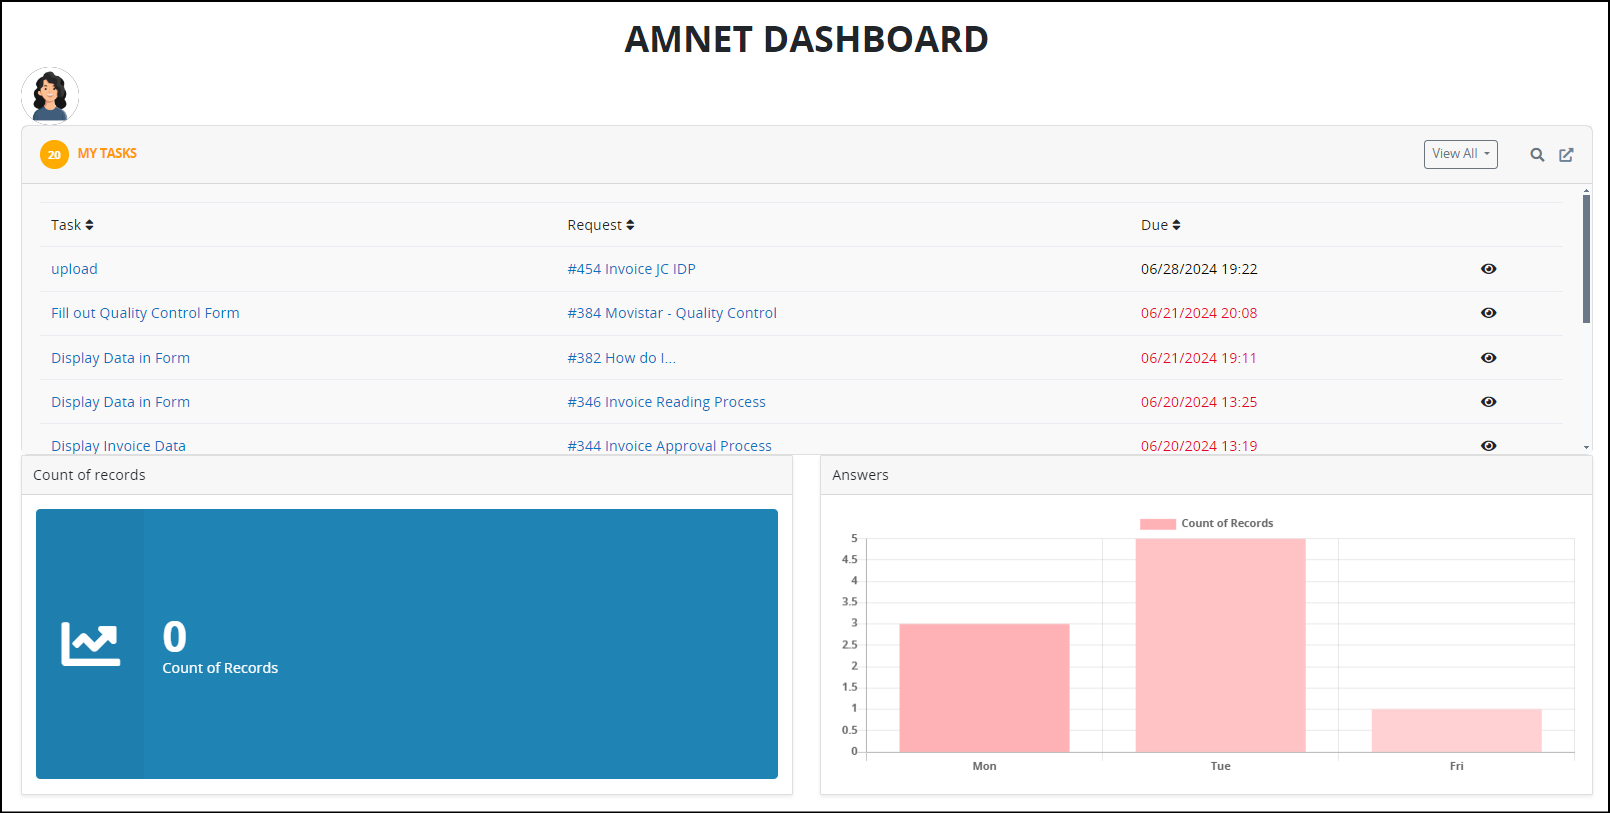
Below are Saved Search Chart controls that display in the Count of records and Answers.
Settings
The Saved Search Chart control has the following configurable settings in the Properties Panel:
Configuration Panel Settings
Expand the Configuration panel from the Properties Panel on the right to configure the following properties:
Chart
Select the Saved Search chart to display in the Screen. If you are not that Saved Search's owner nor have not been shared the Saved Search associated with the chart, that chart does not display in the Chart setting.

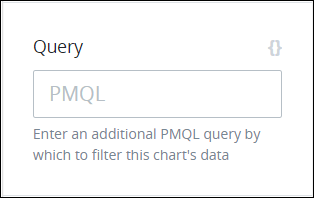
PMQL Query
Enter an additional ProcessMaker Query Language (PMQL) query from which to filter Saved Search results to display in the chart.

Size
Select the size of the Saved Search chart.
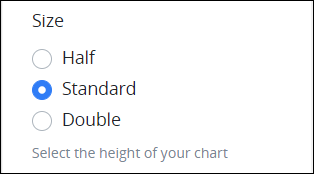
The Size setting options are based on the height of the Saved Search chart. The width of the chart adjusts accordingly. Select from the following options:
Half: The Half option displays the chart by half its height.
Standard: The Standard option displays the chart in its default height. The Standard option is the default setting.
Double: The Double option displays the chart double its default height.
Advanced Panel Settings
Expand the Advanced panel from the Properties Panel on the right to configure the following properties:
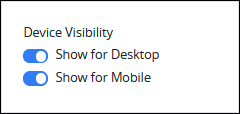
Device Visibility
Select on which device types this control displays:
Desktop: The control displays only on desktop devices. Enable the Show for Desktop toggle key.
Mobile: The control displays only on mobile devices. Enable the Show for Mobile toggle key.
Both: The control displays on both desktop and mobile devices. Both toggle keys are enabled by default.